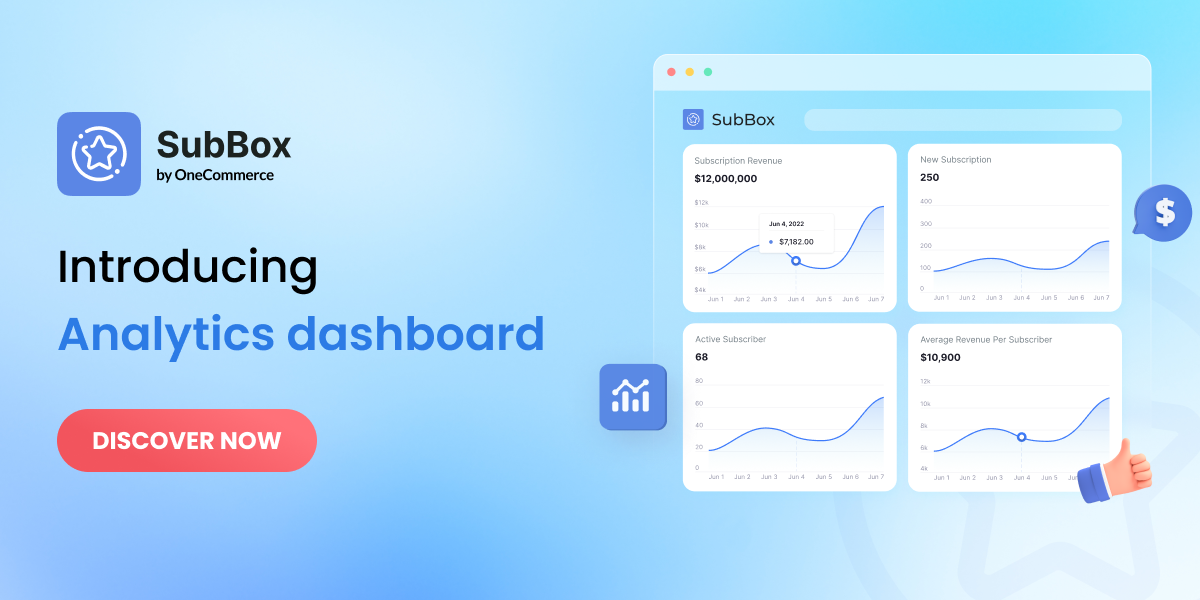
Since the first day SubBox was launched on the Shopify App Store, we’ve been taking it up to eleven and are delighted to finally bring you an important update – the analytics dashboard.
This is the very first update we brought to SubBox as we believe in an old but gold saying ‘You cannot improve on what you don’t measure.’
By having easy access to how your subscriptions perform, we hope you could make more data-driven customizations to your subscription boxes, your email content, your Customer Portal, etc.
Wondering what kind of data can you view in SubBox’s analytics dashboard? Let’s find out together!
SubBox v1.1: Introducing Analytics Dashboard!
Now as you navigate to SubBox app, you’ll notice there’s a Dashboard tab that has just been added to the navigation bar.
Click on it and here we go, below is how the dashboard will look like:
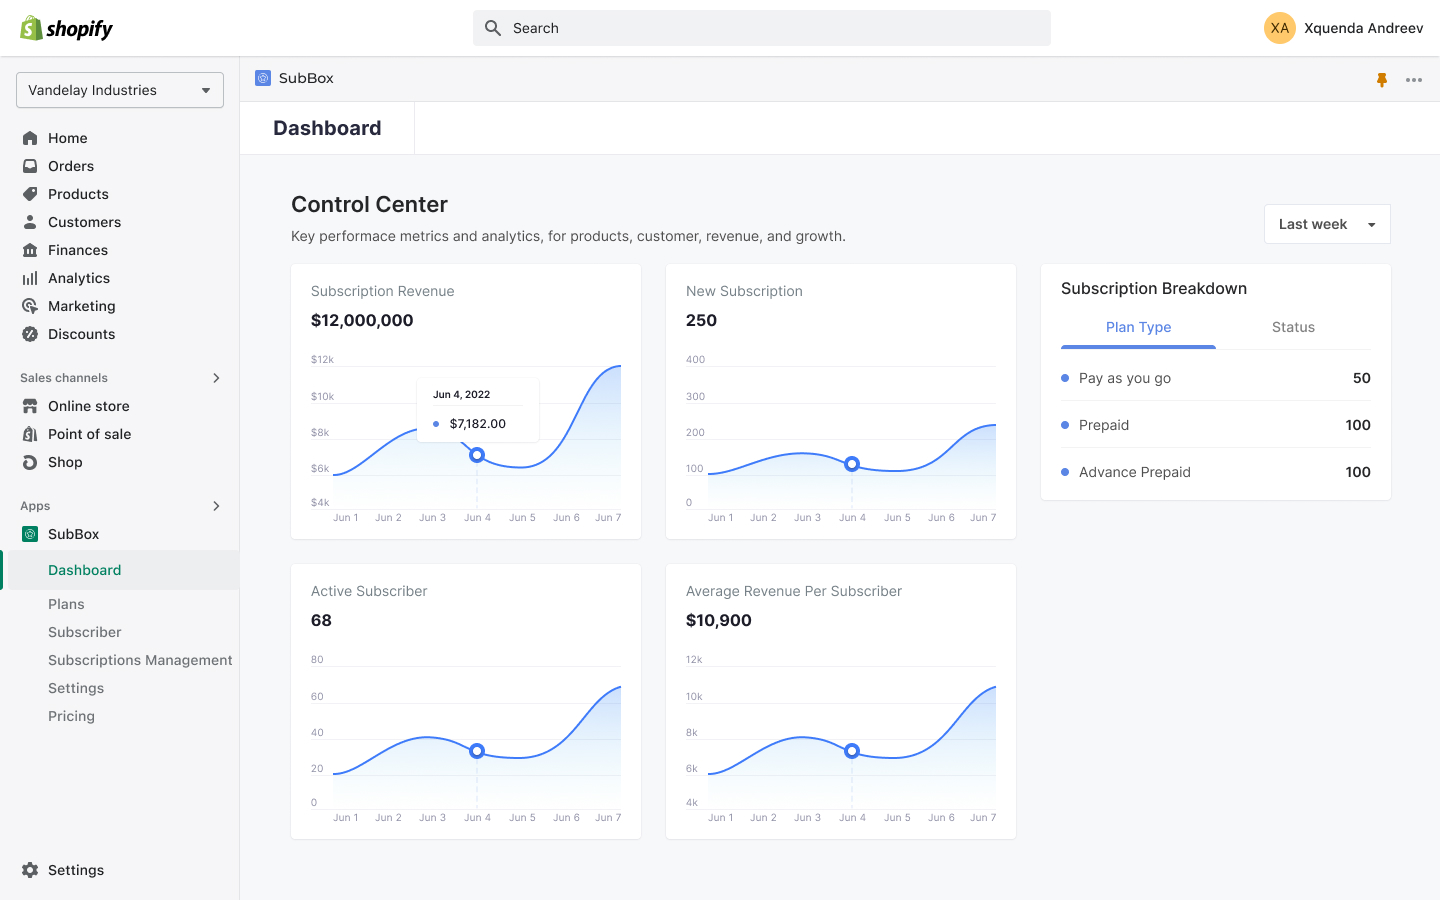

They are all important metrics you need to know to see how your subscription business is performing:
- Subscription Revenue tells you how much money you make from selling your products in the subscription-based model after excluding taxes and costs such as shipping fees
- New Subscription shows you the number of new subscriptions your customers subscribe to in a predefined time range
- Active subscribers shows you how many subscribers are actually buying your products under the subscription model. One active subscriber is calculated as a subscriber with at least 1 active subscription.
- Average Revenue Per Subscriber estimates how much revenue you can earn from one average subscriber
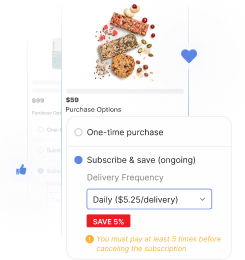
- Subscription Breakdown lets you view how many customers subscribe to each of your subscription types (pay as you go, prepaid & advanced prepaid)
Please be noted that SubBox’s analytic dashboard isn’t complete yet as we’re trying to bring in more metrics so you could make more informed decisions and improve your conversion thereby.
So what metrics do you find important and want to view? Let us know so we could work things out for you!
Let’s track your subscription store performance!
And that’s everything we brought you in SubBox V1.1. Should you have any questions or concerns regarding this latest version of SubBox, don’t hesitate to reach out to our dedicated customer support at support@socialhead.io

Grow endless recurring revenue with SubBox.
Instantly enable subscription model & boost Customer Lifetime Value to new heights!
Get Free app!

Alexandre Le
I'm Alexandre Le - a marketer with 5+ years of hands-on experience in the eCommerce industry. I want to use my expertise and personal perspectives to produce insightful blog posts that help online store owners to launch, run, and scale up their businesses successfully.